Plotting the Baseline Cumulative Rate Function for the Recurrent Event Process
Source:R/plot.R
plotRate.RdPlot the baseline cumulative rate function for an reReg object.
Arguments
- x
an object of class
reReg, usually returned by thereRegfunction.- newdata
an optional data frame contains variables to include in the calculation of the cumulative rate function. If omitted, the baseline rate function will be plotted.
- frailty
an optional vector to specify the shared frailty for
newdata. Ifnewdatais given andfrailtyis not specified, the- showName
an optional logical value indicating whether to label the curves when
newdatais specified.- type
a character string specifying the type of rate function to be plotted. Options are "unrestricted", "scaled", "bounded". See Details.
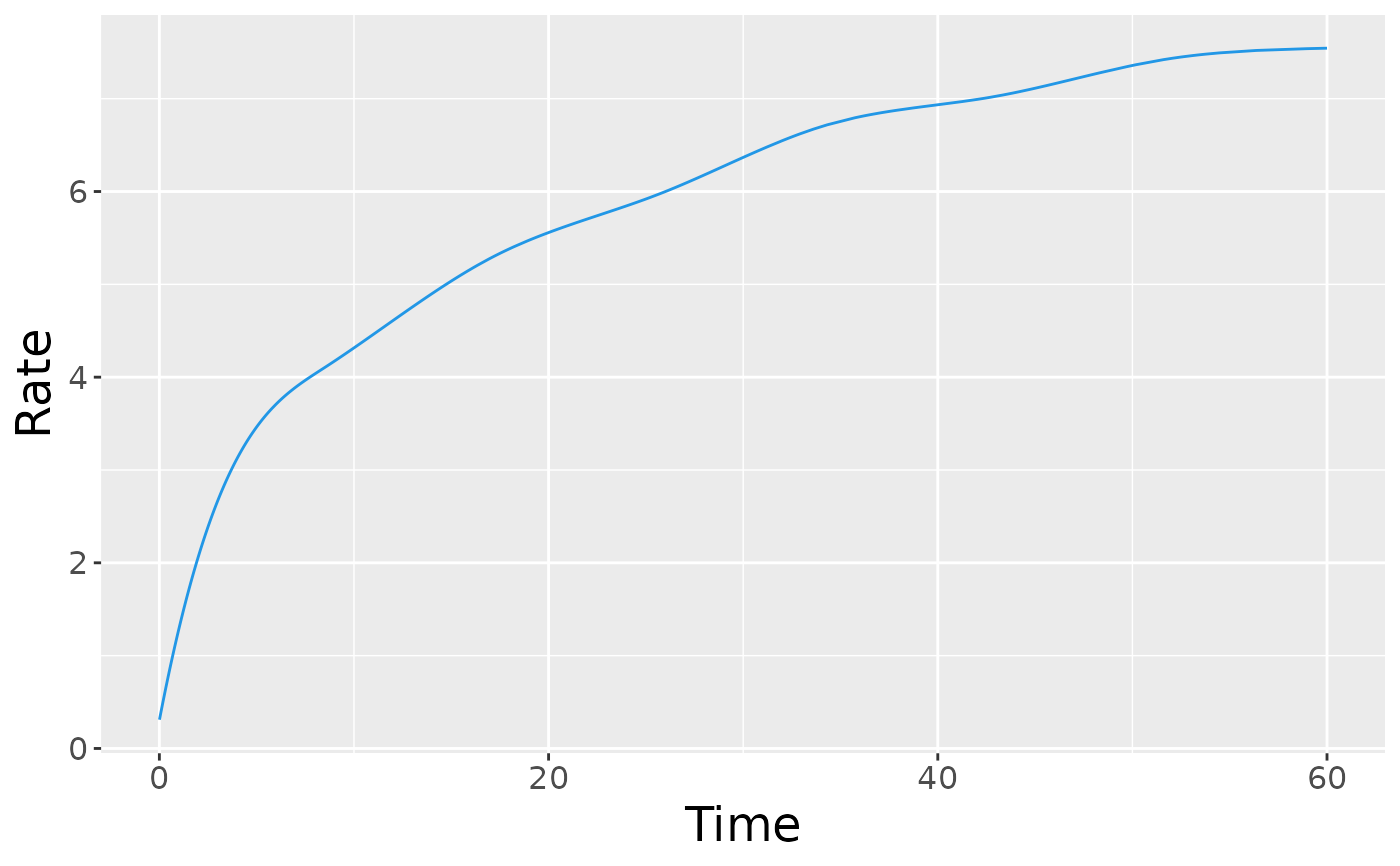
- smooth
an optional logical value indicating whether to add a smooth curve obtained from a monotone increasing P-splines implemented in package
scam.- control
a list of control parameters.
- ...
graphical parameters to be passed to methods. These include
xlab,ylab,main, and more. See Details.
Value
A ggplot object.
Details
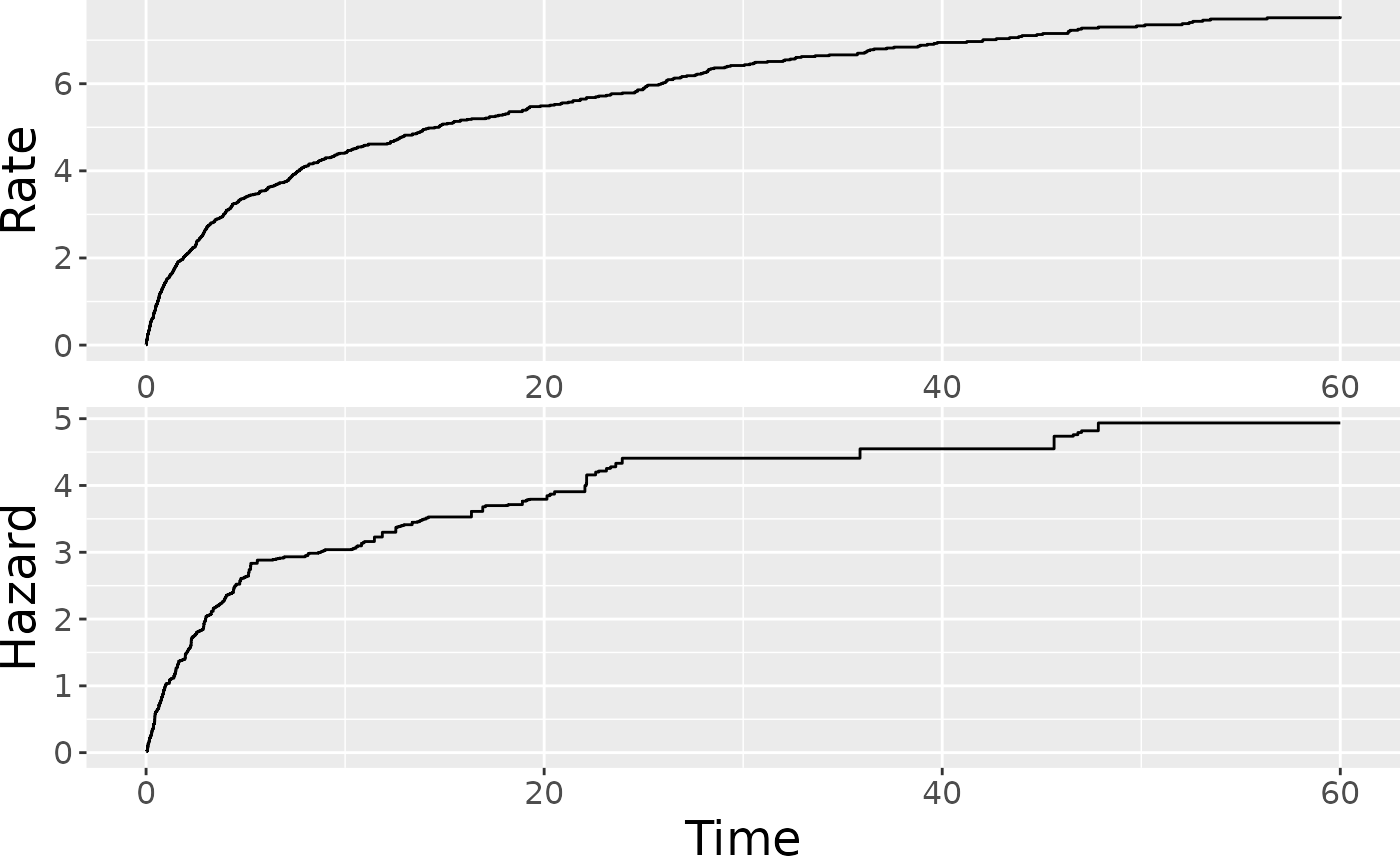
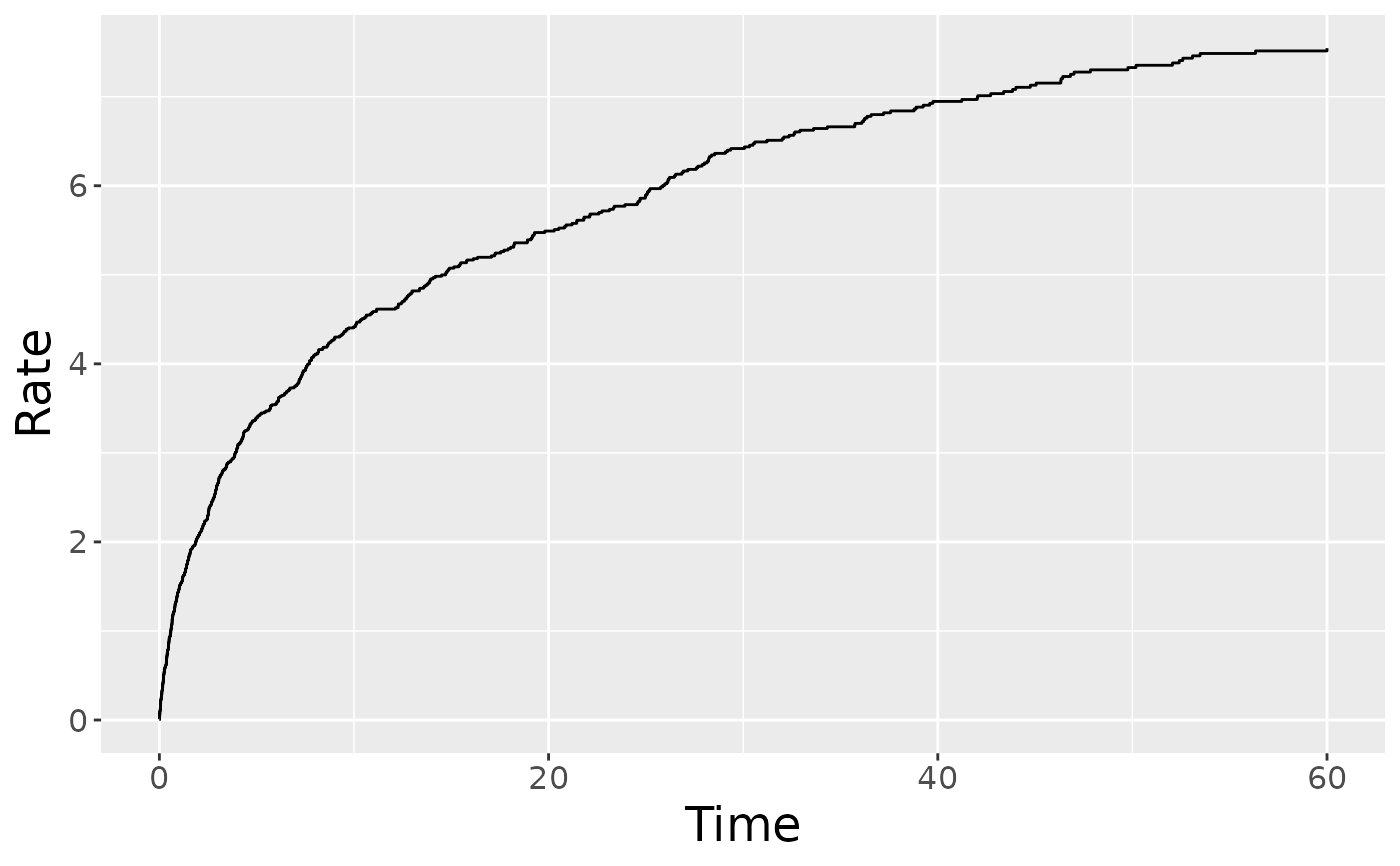
The plotRate() plots the estimated baseline cumulative rate function
depending on the identifiability assumption.
When type = "unrestricted" (default), the baseline cumulative rate function
is plotted under the assumption \(E(Z) = 1\).
When type = "scaled", the baseline cumulative rate function is plotted
under the assumption \(\Lambda(\min(Y^\ast, \tau)) = 1\).
When type = "bounded", the baseline cumulative rate function is plotted
under the assumption \(\Lambda(\tau) = 1\).
See ?reReg for the specification of the notations and underlying models.
The argument control consists of options with argument defaults
to a list with the following values:
- xlab
customizable x-label, default value is "Time".
- ylab
customizable y-label, default value is empty.
- main
customizable title, default value is "Baseline cumulative rate function".
These arguments can also be specified outside of the control list.