Plot the event plot or the mean cumulative function (MCF) from an Recur object.
Arguments
- x
an object of class
Recurreturned by theRecur()function. See?Recurfor creatingRecurobjects.- mcf
an optional logical value indicating whether the mean cumulative function (MCF) will be plotted instead of the event plot. When
mcf = TRUE, themcfis internally called. Seemcffor details.- event.result
an optional character string that is passed to the
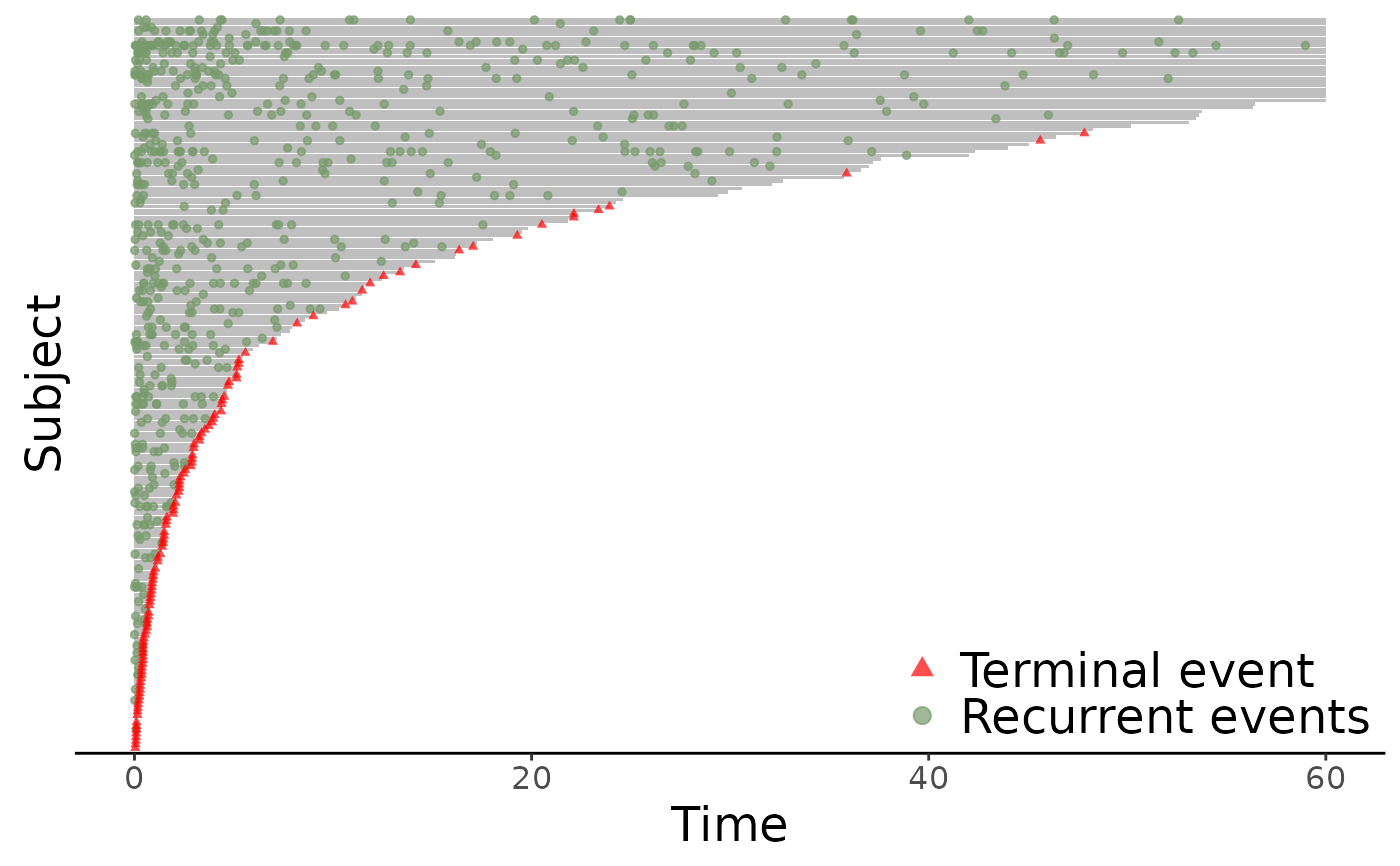
plotEvents()function as theresultargument. SeeplotEvents. This argument is used to specify whether the event plot is sorted by the subjects' terminal time. The available options areincreasingsort the terminal time from in ascending order (default). This places longer terminal times on top.
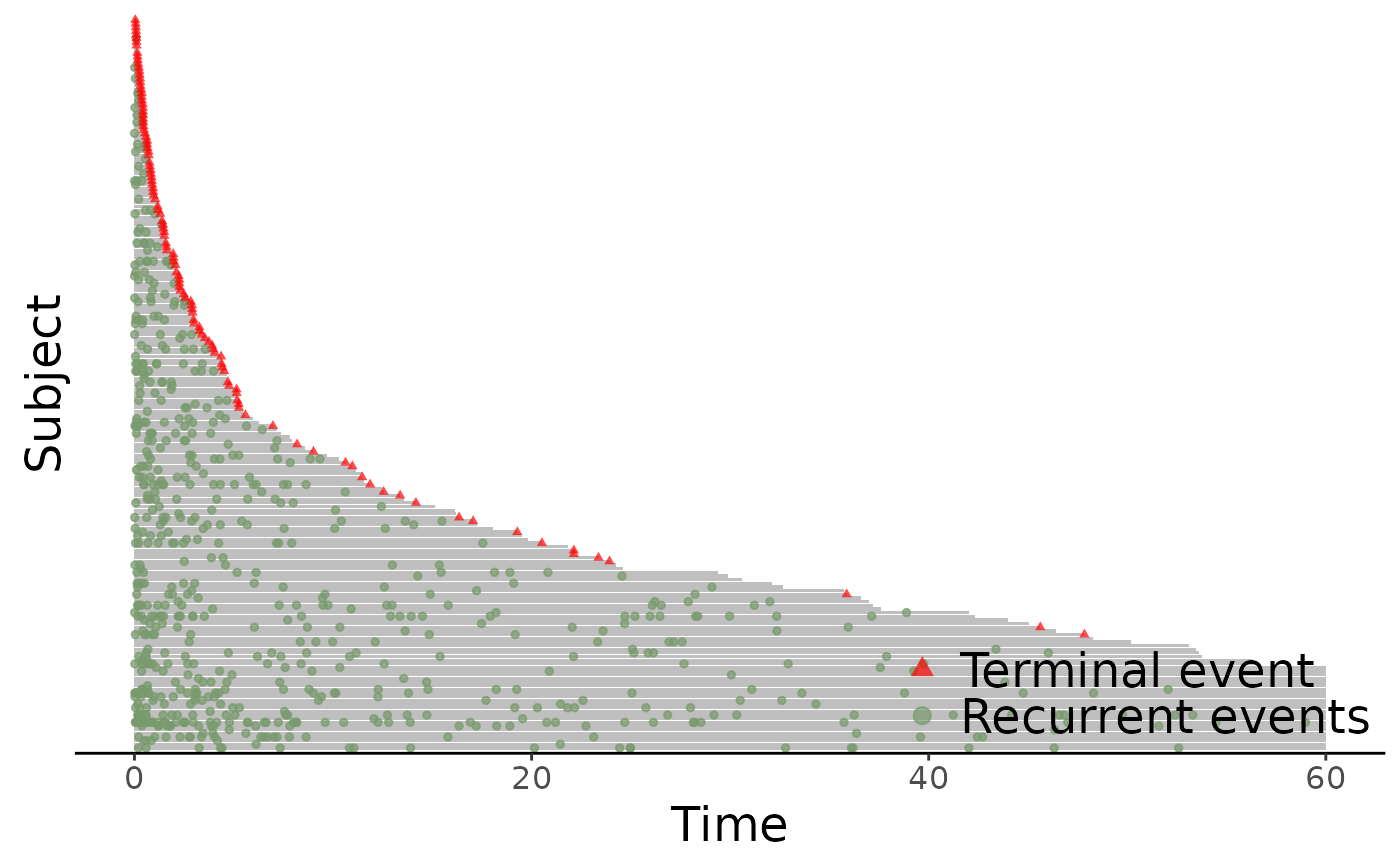
decreasingsort the terminal time from in descending order. This places shorter terminal times on top.
nonepresent the event plots as is, without sorting by the terminal times.
- event.calendarTime
an optional logical value indicating whether to plot in calendar time. When
event.calendarTime = FALSE(default), the event plot will have patient time on the x-axis.- mcf.adjustRiskset
an optional logical value that is passed to the
mcf()function as theadjustRisksetargument. This argument indicates whether risk set size will be adjusted. Ifmcf.adjustRiskset = TRUE, subjects leave the risk set after terminal times as in the Nelson-Aalen estimator. Ifmcf.adjustRiskset = FALSE, subjects remain in the risk set after terminal time.- mcf.conf.int
an optional logical value that is passed to the
mcf()function as theconf.intargument. Seemcffor details.- control
a list of control parameters. See Details.
- ...
additional graphical parameters to be passed to methods.
Value
A ggplot object.
Details
The argument control consists of options with argument defaults to a list with
the following values:
- xlab
customizable x-label, default value is "Time".
- ylab
customizable y-label, default value is "Subject" for event plot and "Cumulative mean" for MCF plot.
- main
customizable title, the default value is "Recurrent event plot" when
mcf = FALSEand "Sample cumulative mean function plot" whenmcf = TRUE.- terminal.name
customizable label for terminal event, the default value is "Terminal event".
- recurrent.name
customizable legend title for recurrent event, the default value is "Recurrent events".
- recurrent.types
customizable label for recurrent event type, the default value is
NULL.- alpha
between 0 and 1, controls the transparency of points.
The xlab, ylab and main parameters can be specified
outside of the control list.
References
Nelson, W. B. (1995) Confidence Limits for Recurrence Data-Applied to Cost or Number of Product Repairs. Technometrics, 37(2): 147--157.
See also
Examples
data(simDat)
reObj <- with(simDat, Recur(t.start %to% t.stop, id, event, status))
## Event plots:
plot(reObj)
 plot(reObj, event.result = "decreasing")
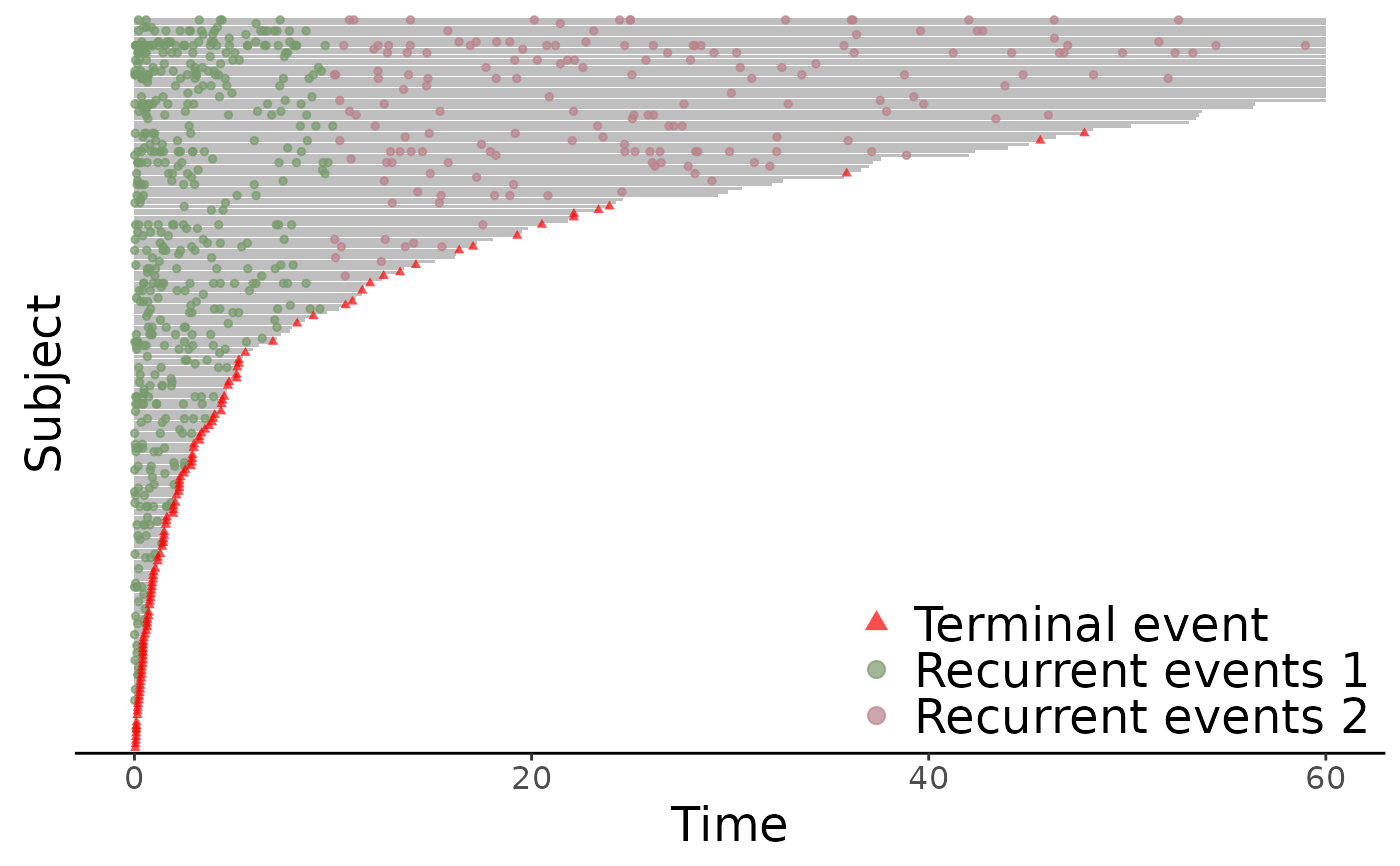
 ## With (hypothetical) multiple event types
simDat$event2 <- with(simDat, ifelse(t.stop > 10 & event > 0, 2, event))
reObj2 <- with(simDat, Recur(t.start %to% t.stop, id, event2, status))
plot(reObj2)
## With (hypothetical) multiple event types
simDat$event2 <- with(simDat, ifelse(t.stop > 10 & event > 0, 2, event))
reObj2 <- with(simDat, Recur(t.start %to% t.stop, id, event2, status))
plot(reObj2)
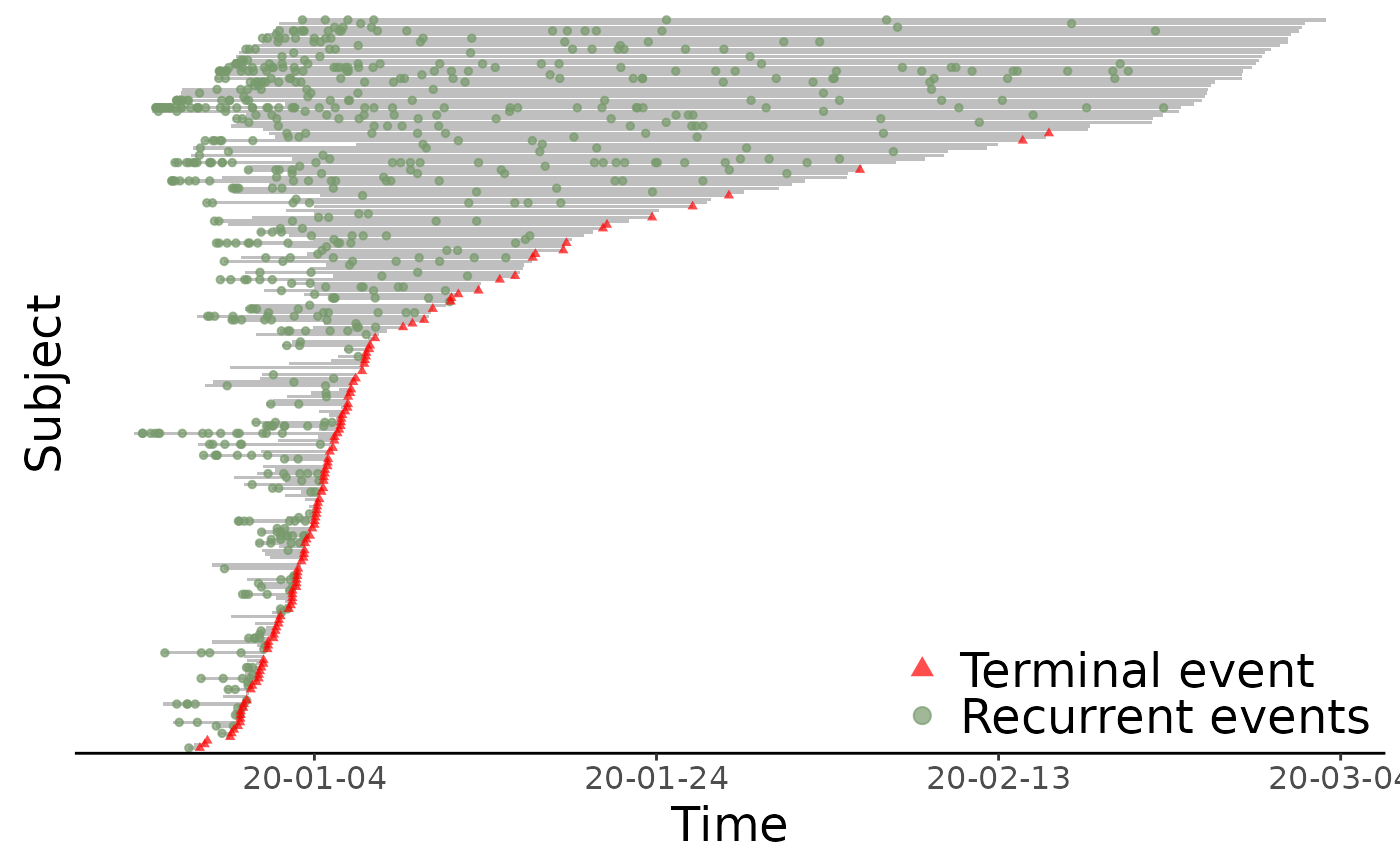
 ## With (hypothetical) calendar times
simDat2 <- simDat
simDat2$t.start <- as.Date(simDat2$t.start + simDat2$x2 * 5, origin = "20-01-01")
simDat2$t.stop <- as.Date(simDat2$t.stop + simDat2$x2 * 5, origin = "20-01-01")
reObj3 <- with(simDat2, Recur(t.start %to% t.stop, id, event, status))
plot(reObj3, event.calendarTime = TRUE)
## With (hypothetical) calendar times
simDat2 <- simDat
simDat2$t.start <- as.Date(simDat2$t.start + simDat2$x2 * 5, origin = "20-01-01")
simDat2$t.stop <- as.Date(simDat2$t.stop + simDat2$x2 * 5, origin = "20-01-01")
reObj3 <- with(simDat2, Recur(t.start %to% t.stop, id, event, status))
plot(reObj3, event.calendarTime = TRUE)
 ## MCF plots
plot(reObj, mcf = TRUE)
## MCF plots
plot(reObj, mcf = TRUE)
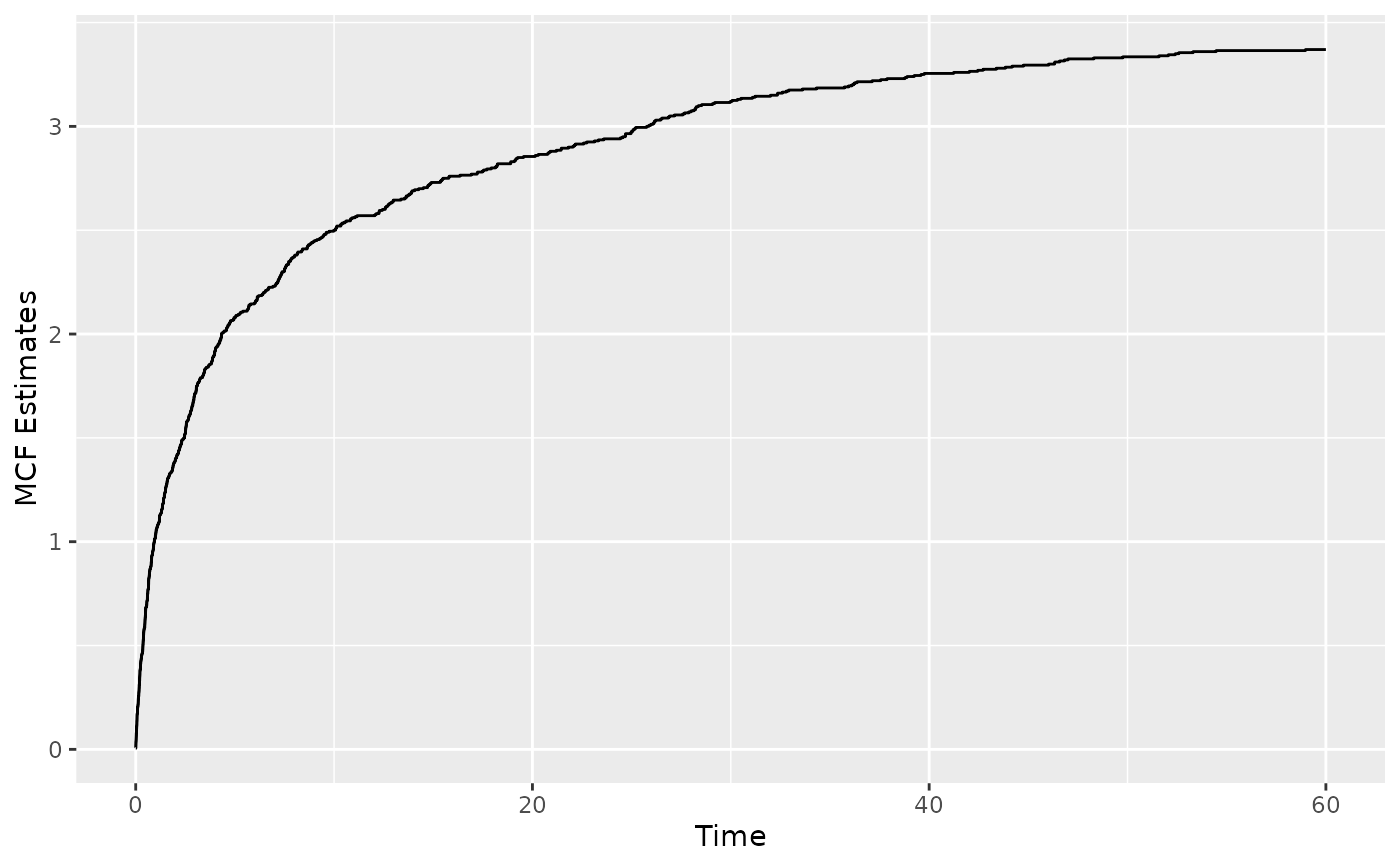
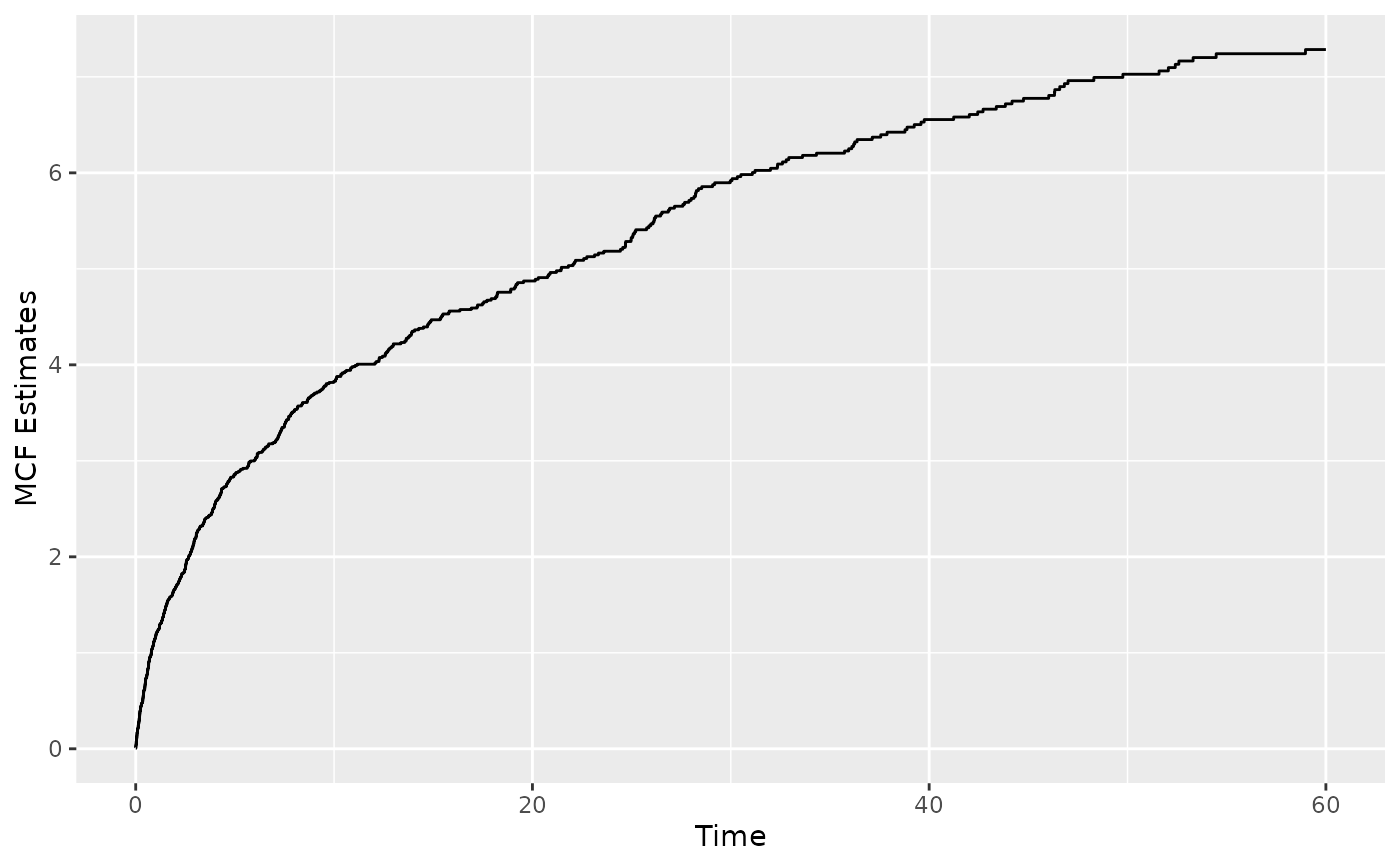 plot(reObj, mcf = TRUE, mcf.adjustRiskset = FALSE)
 library(reReg)
data(simDat)
reObj <- with(simDat, Recur(t.start %to% t.stop, id, event, status))
summary(reObj)
#> Call:
#> Recur(time = t.start %to% t.stop, id = id, event = event, terminal = status)
#>
#> Sample size: 200
#> Number of recurrent event observed: 674
#> Average number of recurrent event per subject: 3.37
#> Proportion of subjects with a terminal event: 0.59
#> Median follow-up time: 4.735
#> Median time-to-terminal event: 6.975
library(reReg)
data(simDat)
reObj <- with(simDat, Recur(t.start %to% t.stop, id, event, status))
summary(reObj)
#> Call:
#> Recur(time = t.start %to% t.stop, id = id, event = event, terminal = status)
#>
#> Sample size: 200
#> Number of recurrent event observed: 674
#> Average number of recurrent event per subject: 3.37
#> Proportion of subjects with a terminal event: 0.59
#> Median follow-up time: 4.735
#> Median time-to-terminal event: 6.975