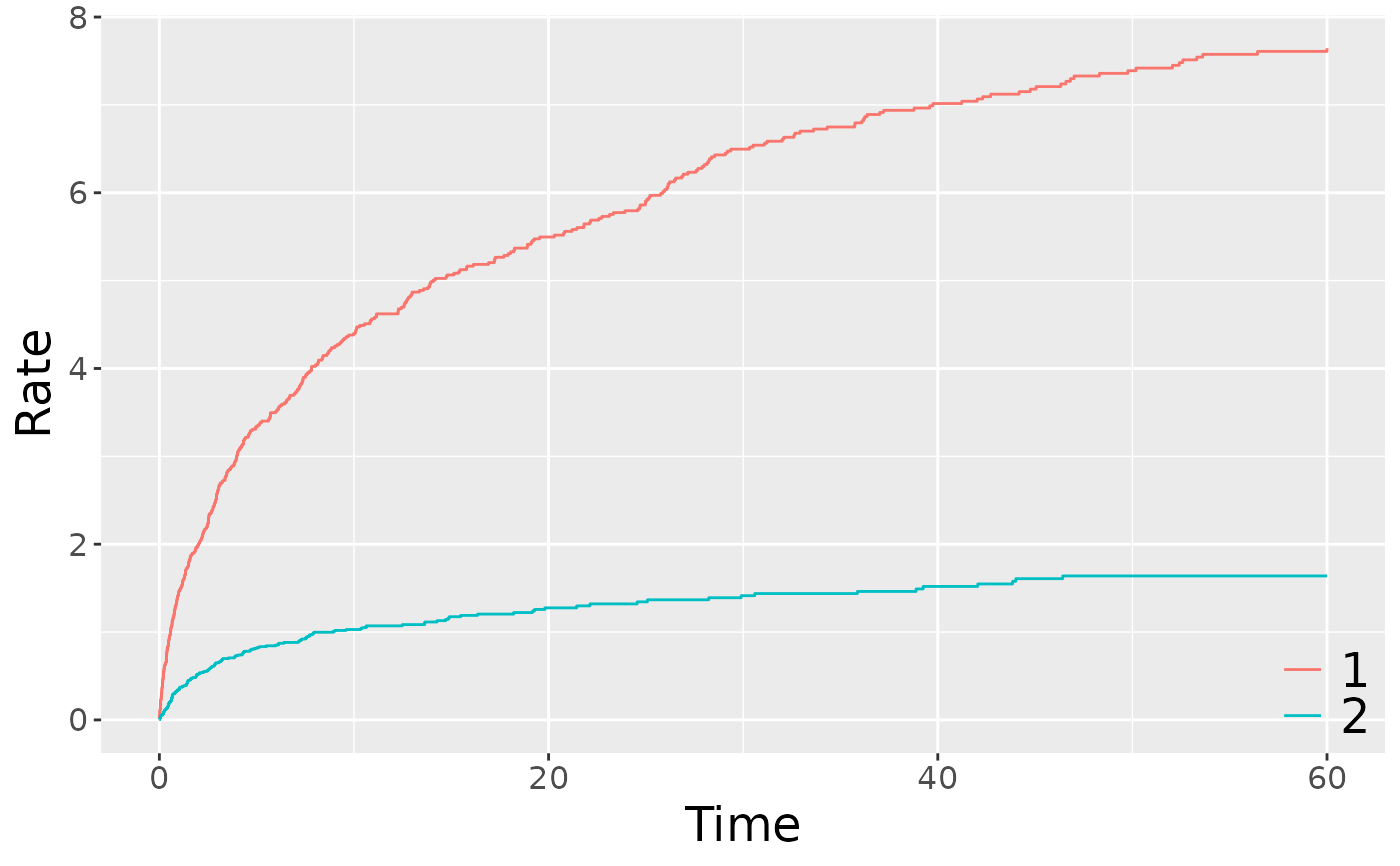
Combine different plots into one.
basebind(..., legend.title, legend.labels, control = list())Arguments
- ...
ggplotobjects created by plottingreRegobjects.- legend.title
an optional character string to specify the legend title.
- legend.labels
an optional character string to specify the legend labels.
- control
a list of control parameters.
