A data frame contains data on recurrences of bladder cancer,
used by many people to demonstrate methodology for recurrent event modelling.
This data set organized differently from bladTumor.
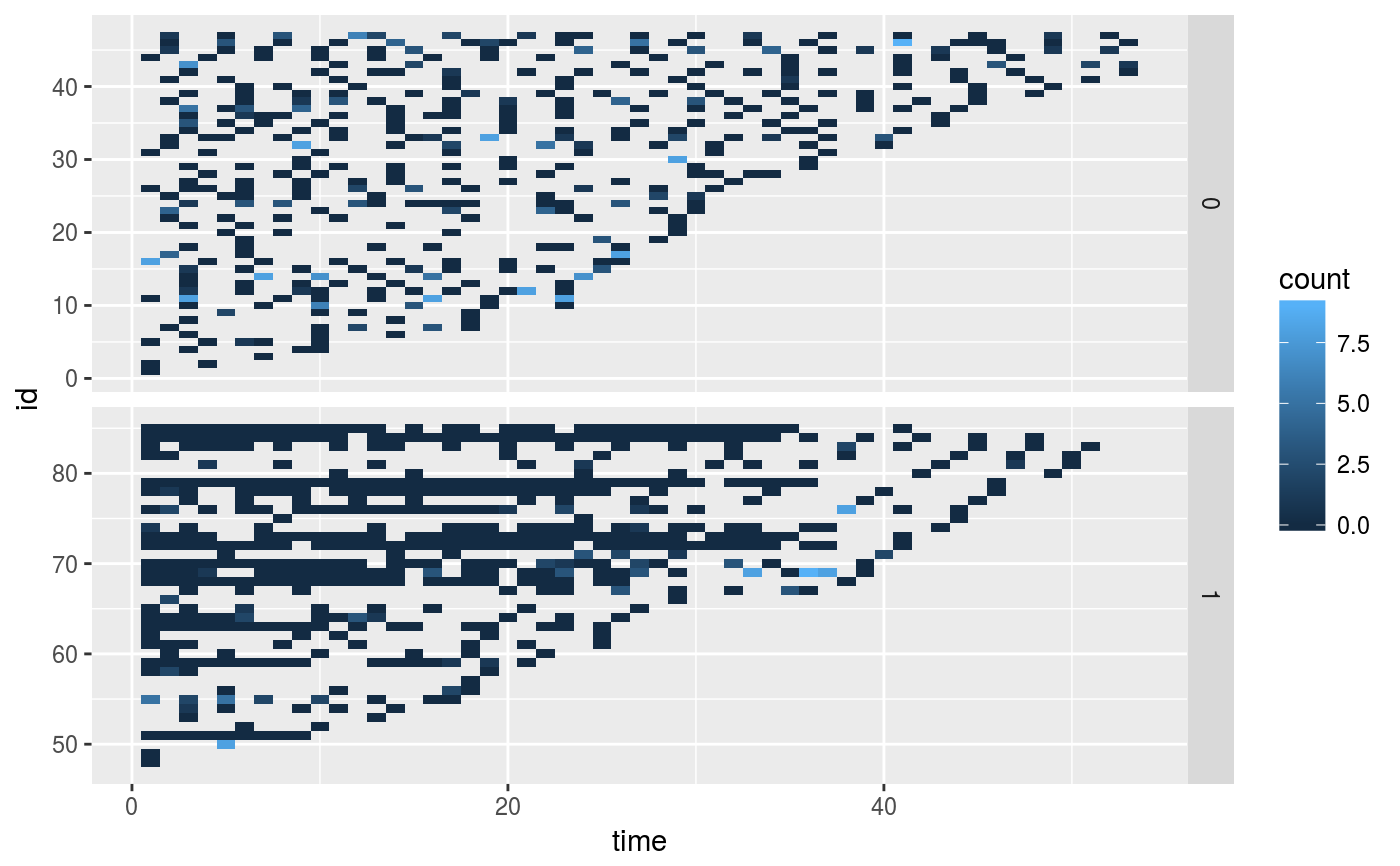
The data contains records of 85 patients from two treatment arms:
48 are from the placebo arm, and the rest 37 are from the thiotepa arm.
data(blaTum)
Format
A data.frame contains the following columns:
idpatient id
treatmentplacebo = 0, thiotepa = 1
sizesize (cm) of largest initial tumor
numinitial number of tumors (8 = 8 or more)
timeobservation time
countnumber of new tumors since last observation time
Note
To our surprise, the two-treatment (placebo and thiotepa) subset of
the full version bladTumor do not match the two-treatment version blaTum.
References
Byar, D. P. (1980). The Veterans administration study of chemoprophylaxis for recurrent stage I bladder tumors: comparisons of placebo, pyridoxine, and topical thiotepa. Bladder Tumors and Other Topics in Urological Oncology, pp. 363--370. New York: Plenum.
Sun, J. and Wei, L. J. (2000) Regression analysis of panel count data with covariate dependent observation and censoring times. Journal of the Royal Statistical Society, Series B: Statistical Methodology, 62(2), 293--302.
Huang, C. Y., Wang, M. C. and Zhang, Y. (2006). Analyzing panel count data with informative observation times. Biometrika, 93(4): 763--776.
See also
Examples
data(blaTum)
library(ggplot2)
ggplot(blaTum, aes(time, id)) + geom_tile(aes(fill=count)) +
   facet_grid(treatment ~ ., scales="free_y", )