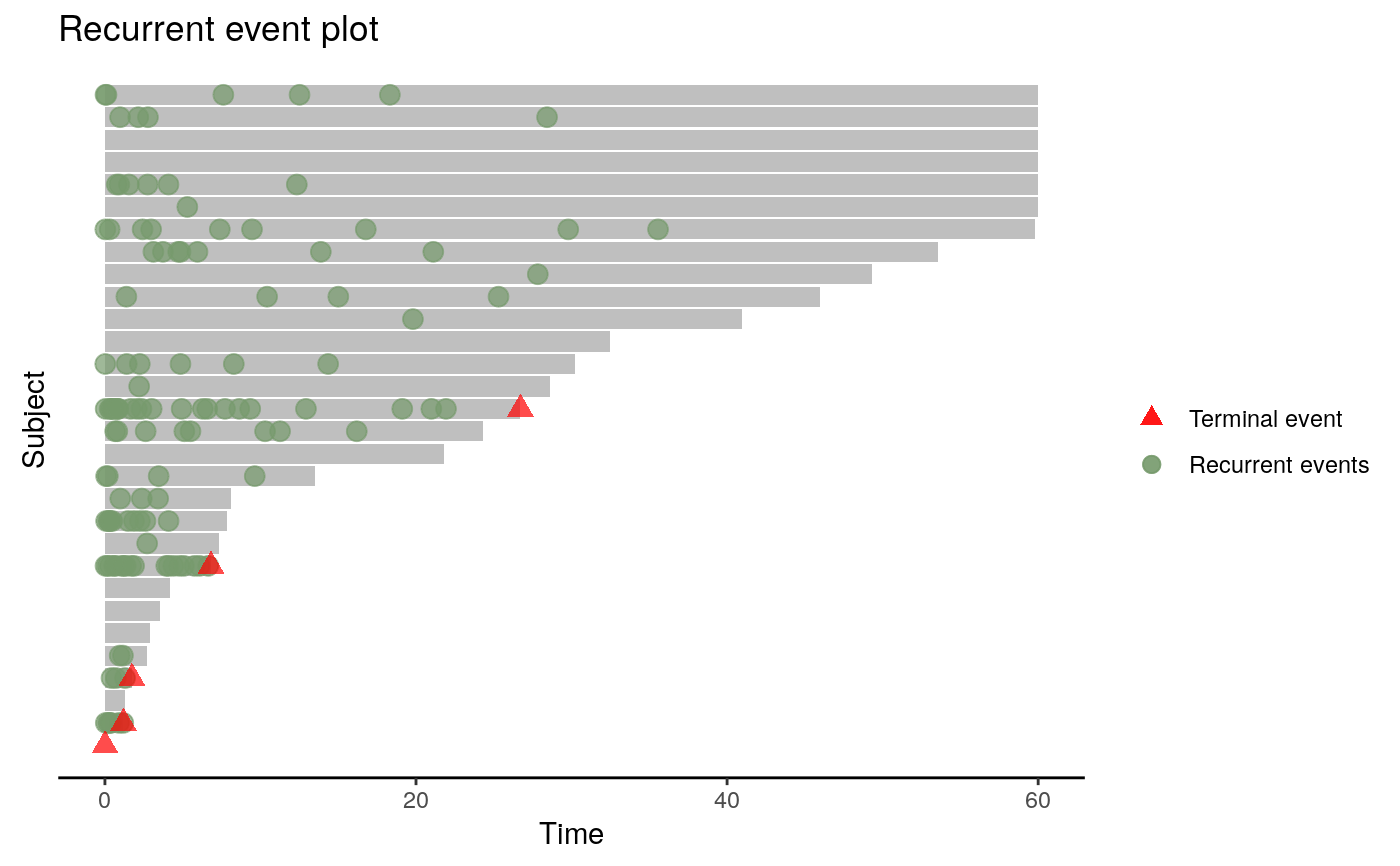
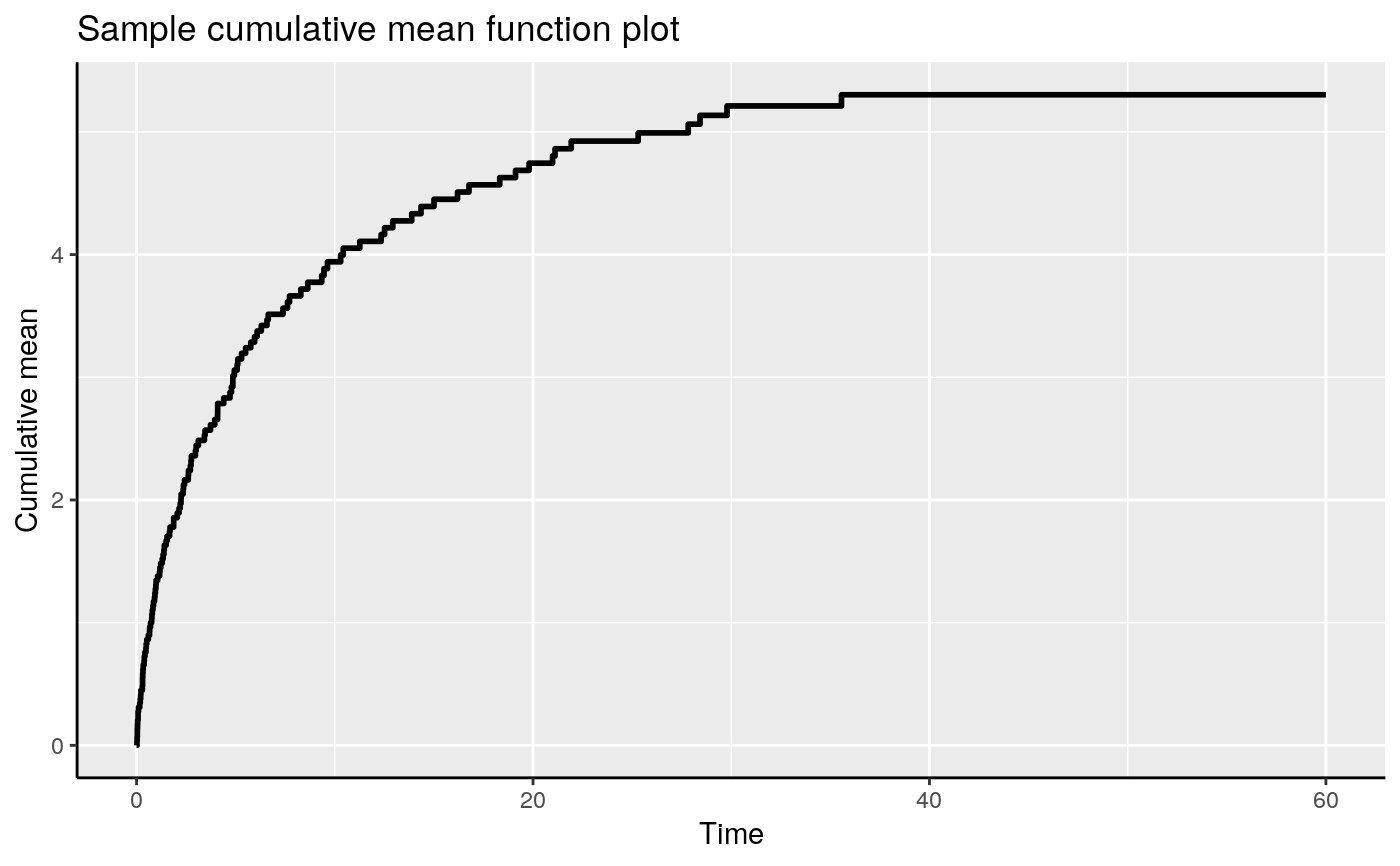
Plot the event plot or the cumulative sample mean (CSM) function for an reSurv object.
# S3 method for reSurv
plot(x, CSM = FALSE, order = TRUE, control = list(),
  ...)
Arguments
| x | an object of class |
|---|---|
| CSM | an optional logical value indicating whether the cumulative sample mean (CSM) function will be plotted instead of the event plot (default). |
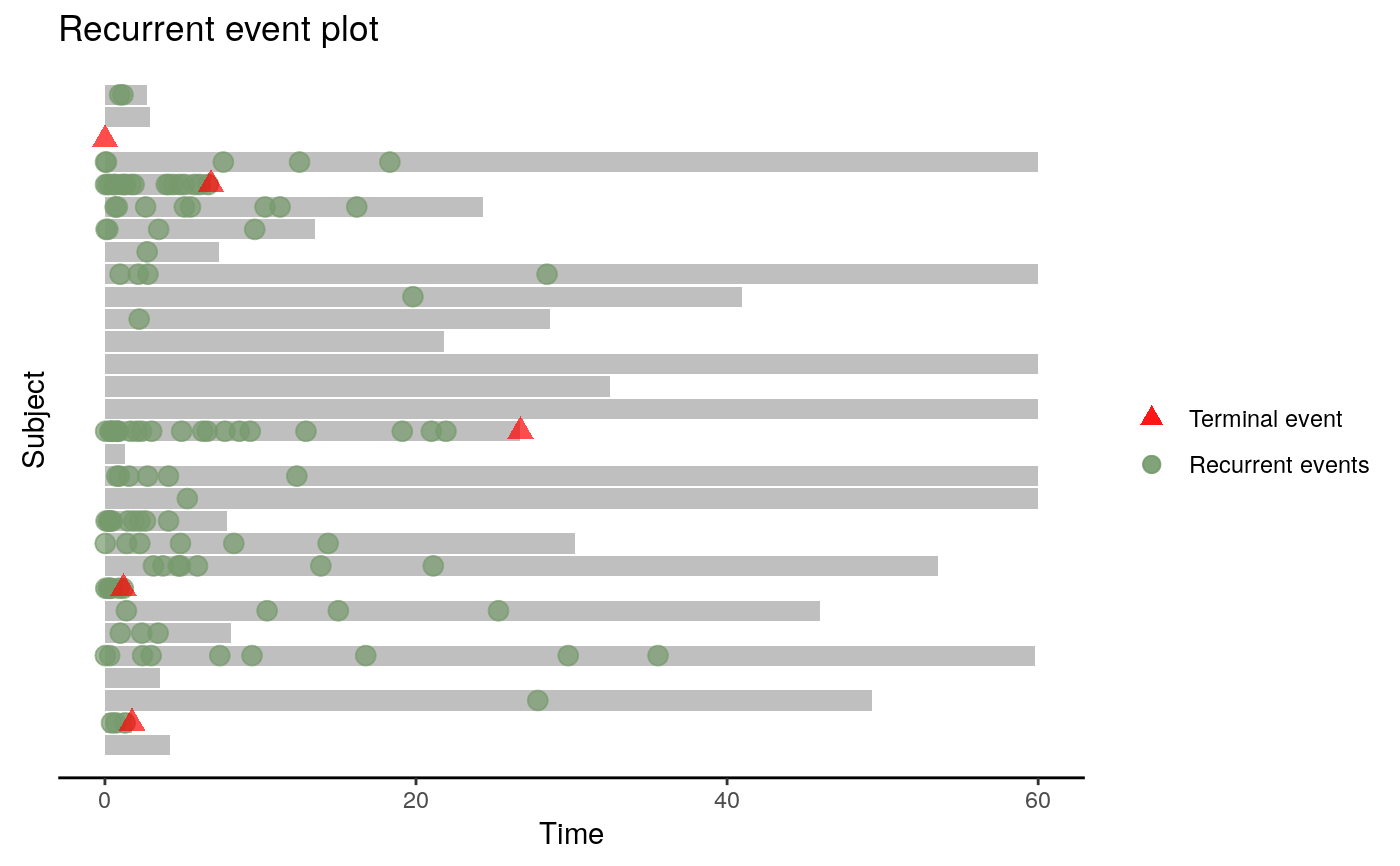
| order | an optional logical value indicating whether the event plot (when |
| control | a list of control parameters. See Details. |
| ... | graphical parameters to be passed to methods.
These include |
Value
A ggplot object.
Details
The argument control consists of options with argument defaults to a list with the following values:
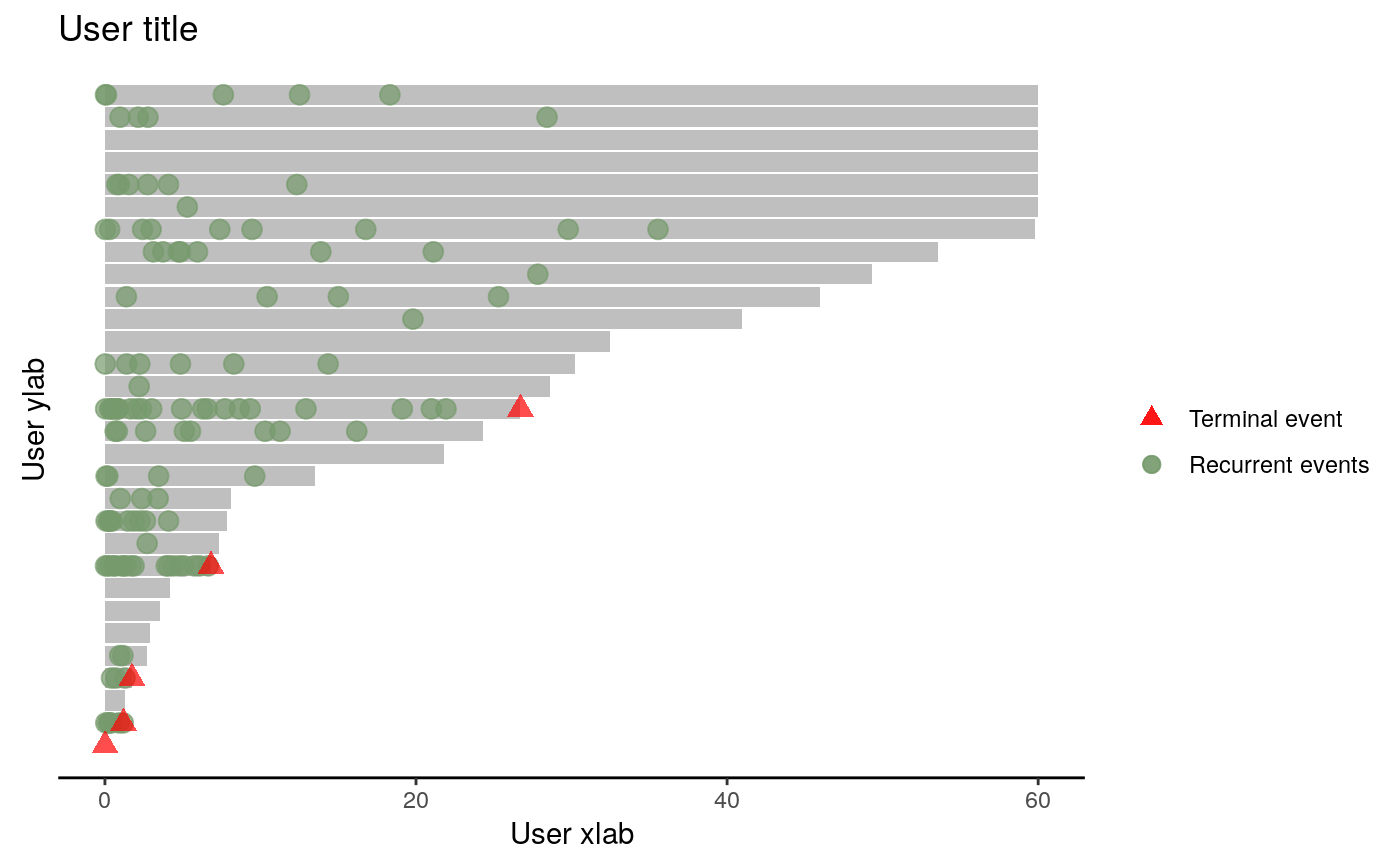
- xlab
customizable x-label, default value is "Time".
- ylab
customizable y-label, default value is "Subject" for event plot and "Cumulative mean" for CSM plot.
- main
customizable title, the default value is "Recurrent event plot" when
CSM = FALSEand "Sample cumulative mean function plot" whenCSM = TRUE.- terminal.name
customizable label for terminal event, default value is "Terminal event".
- recurrent.name
customizable legend title for recurrent event, default value is "Recurrent events".
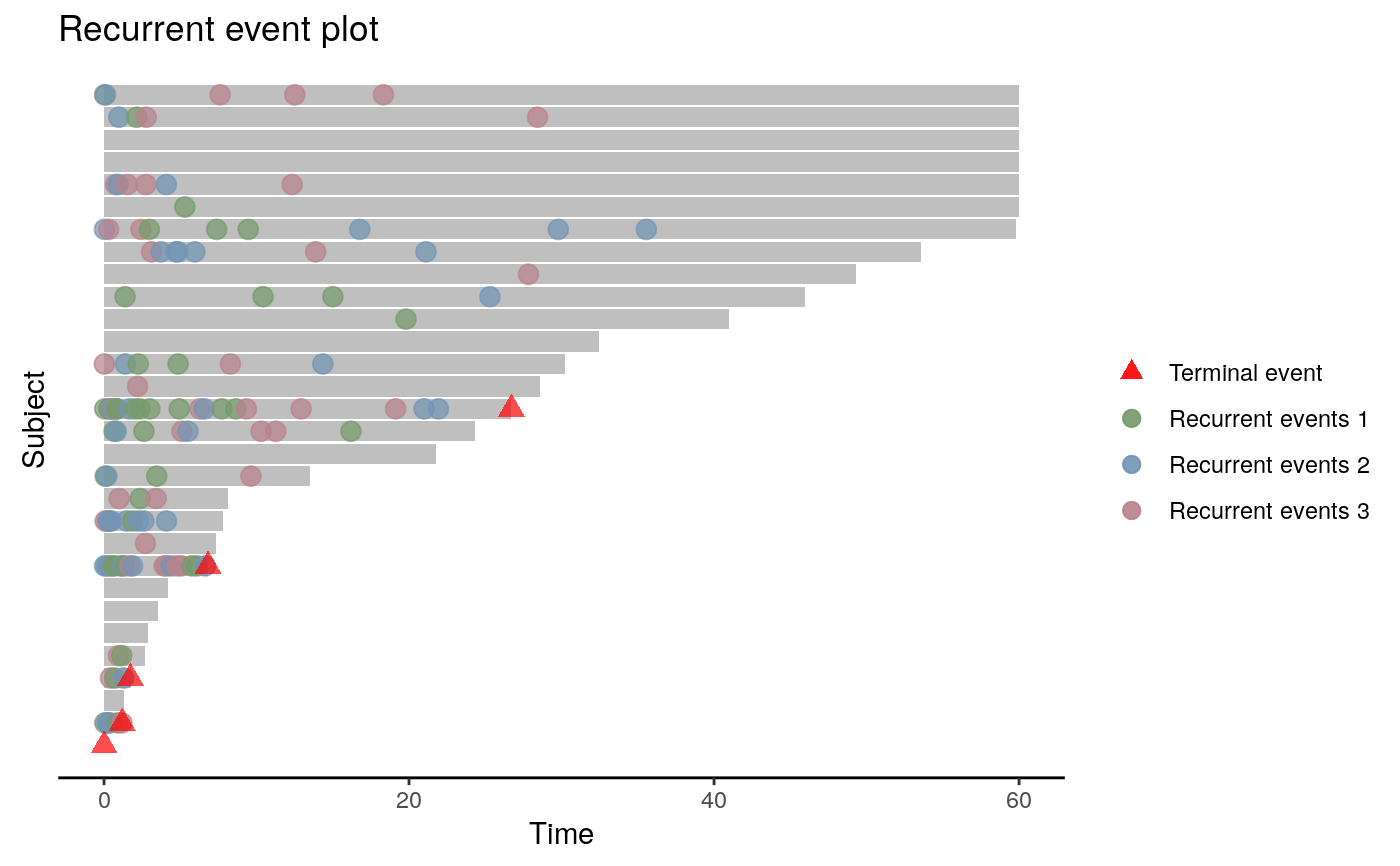
- recurrent.types
customizable label for recurrent event type, default value is
NULL.- alpha
between 0 and 1, controls the transparency of points.
The xlab, ylab and main parameters can also be passed down without specifying a control list.
See also
Examples
set.seed(1) dat <- simSC(30, c(-1, 1), c(-1, 1)) reObj <- with(dat, reSurv(Time, id, event, status)) ## Event plots: ## Default labels plot(reObj)## User specified labels plot(reObj, control = list(xlab = "User xlab", ylab = "User ylab", main = "User title"))## With hypothetical multiple event types set.seed(1) reObj2 <- with(dat, reSurv(Time, id, event * sample(1:3, nrow(dat), TRUE), status)) plot(reObj2)